In the first installment in my “Understanding ETFs” series, we toured the Canadian equity ETF landscape, covering solutions you can use for your investment portfolio’s domestic stock allocation. Today, I want to switch gears and head south of the border, to explore some of the U.S. equity ETFs you can add in, to diversify your Canadian-heavy portfolio.
In our last episode, we learned Canada created the world’s first ETF in 1990. The U.S. wasn’t far behind us though. In January 1993, State Street Global Advisors launched the first successful U.S.-listed ETF – the SPDR® S&P 500® ETF, or SPY. The SPY mission: to follow the S&P 500 Index, which Standard & Poor’s created in the 1950s to track the performance of around 500 larger U.S. companies.
SPDR (pronounced “spider”) is an acronym for “Standard & Poor’s Depository Receipt.” It’s trademarked by Standard and Poor’s Financial Services, but the acronym is so popular, it’s often confused as a generic term for any S&P 500-tracking ETF.
SPY’s largest holdings include a number of familiar names most Canadians will instantly recognize.
| Company | Symbol | Weigh |
|---|---|---|
| Apple Inc. | AAPL | 4.2% |
| Microsoft Corporation | MSFT | 3.6% |
| Amazon.com Inc. | AMZN | 3.3% |
| Berkshire Hathaway Inc. Class B | BRK.B | 1.7% |
| Facebook Inc. Class A | FB | 1.6% |
| JPMorgan Chase & Co. | JPM | 1.5% |
| Johnson & Johnson | JNJ | 1.5% |
| Alphabet Inc. Class C | GOOG | 1.5% |
| Alphabet Inc. Class A | GOOGL | 1.5% |
| Exxon Mobil Corporation | XOM | 1.5% |
Whether you are investing in U.S. or Canadian dollars, there are quite a few ETFs that track the S&P 500 Index and trade on either the U.S. or Canadian stock exchanges.
| U.S.-listed | Canadian-Listed |
|---|---|
| SPDR® S&P 500® ETF (SPY) | BMO S&P 500 Index ETF (ZSP) |
| iShares Core S&P 500 ETF (IVV) | iShares Core S&P 500 Index ETF (XUS) |
| Vanguard S&P 500 ETF (VOO) | Vanguard S&P 500 Index ETF (VFV) |
Each company in the S&P 500 Index is weighted according to its “float-adjusted” market capitalization. For more information on float-adjusted market caps, please watch my last video or read my blog post on Understanding Canadian Equity ETFs.
As if the thought of spiders taking over the planet isn’t creepy enough, let’s add some venomous snakes to the mix. Not to be outdone by the success of the SPDRs, Vanguard launched their own version of ETFs in 2001, originally known as Vanguard Index Participation Receipts, or VIPERS for short.
The Vanguard Extended Market ETF (VXF) was the second ETF Vanguard launched. You may be familiar with some of its holdings as well.
| Company | Symbol | Weight |
|---|---|---|
| Tesla Inc. | TSLA | 0.7% |
| ServiceNow Inc. | NOW | 0.7% |
| Worldpay Inc. Class A | WP | 0.6% |
| Square Inc. | SQ | 0.6% |
| T-Mobile US Inc. | TMUS | 0.4% |
| Las Vegas Sands Corp | LVS | 0.4% |
| Workday Inc. Class A | WDAY | 0.4% |
| Palo Alto Networks Inc. | PANW | 0.4% |
| Dell Technologies Inc. Class V | DVMT | 0.4% |
| Splunk Inc. | SPLK | 0.3% |
Source: State Street Global Advisors Funds Distributors, LLC as of September 28, 2018
VXF complements SPY by following the S&P Completion Index, which in turn tracks the performance of over 3,000 U.S. mid-, small-, and micro-cap companies.
| Tracking ETF | Symbol | MER (%) | Underlying Index | Number of Stocks | Dividend Yield (%) |
|---|---|---|---|---|---|
| SPDR® S&P 500® ETF | SPY | 0.09% | S&P 500 Index | 505 | 1.9% |
| Vanguard Extended Market ETF | VXF | 0.08% | S&P Completion Index | 3,316 | 1.3% |
By allocating about 82% of your investment dollars to SPY, and the remaining 18% to VXF, you gain float-adjusted market-cap exposure to most of the U.S. stock market, at an annual MER of about 0.09%.
Good news for creepy-crawly lovers everywhere: There is a single index that follows a combination of the S&P 500 Index and the S&P Completion Index. It’s called the S&P Total Market Index. This index includes about 3,825 companies and covers the broad U.S. stock market.
Luckily, there also are ETFs that invest in all companies within the S&P Total Market Index – so you can invest in one fund instead of two, and achieve the same goal either way.
The iShares Core S&P Total U.S. Stock Market ETF (ITOT) trades on the U.S. stock exchange in U.S. dollars. When held in a tax-deferred account – such as an RRSP, LIRA, RRIF, or LIF – the usual 15% withholding tax on foreign dividends does not apply, saving Canadian investors about 0.26% per year in taxes.
Its sister ETF, the iShares Core S&P U.S. Total Market Index ETF (XUU), trades on the Canadian stock exchange in Canadian dollars. When held in a registered account, the 15% withholding tax on foreign dividends is lost, resulting in a tax drag of about 0.26% per year.
Both ITOT and XUU have lower annual costs than the weighted-average cost of SPY + VXF, which makes them more cost-effective alternatives to the multi-fund approach.
In choosing between the two (ITOT vs. XUU), the decision is typically driven by the impact of foreign withholding taxes. That’s a complicated topic, beyond the scope of today’s discussion. But at the end of this post, I’ve summarized the estimated tax drag of several broad market U.S. equity ETFs when a Canadian investor holds them in various account types. You also can refer to our white paper on the subject, as well as our YouTube videos on the Norbert’s gambit strategy (a cheap way to convert your loonies to dollars for purchasing U.S.-listed ETFs in your registered accounts).
| ETF | Symbol | MER (%) | Underlying Index | Number of Stocks | Dividend Yield |
|---|---|---|---|---|---|
| iShares Core S&P Total U.S. Stock Market ETF | ITOT | 0.03% | S&P Total Market Index | 3,825 | 1.8% |
| iShares Core S&P U.S. Total Market Index ETF | XUU | 0.07% | S&P Total Market Index | 3,825 | 1.8% |
Sources: BlackRock Inc., S&P Dow Jones Indices as of September 28, 2018
Vanguard has also released a number of ETFs that provide similar exposure to U.S. equity markets. Their most popular ETFs follow the CRSP indices. CRSP stands for Center for Research in Security Prices.
The CRSP US Large Cap Index includes about 602 U.S. large-cap stocks, so its exposure is very similar to the S&P 500 Index. If you combine about 85% of this large-cap index with roughly 13% of the CRSP US Small Cap Index, and about 2% of the CRSP US Micro Cap Index, you end up with the CRSP US Total Market Index, which is very similar in composition to the S&P Total Market Index.
Although Vanguard offers U.S.-listed ETFs that track the CRSP US Large Cap Index and the CRSP US Small Cap Index, they do not yet offer an ETF that tracks the CRSP US Micro Cap Index. That means combining multiple ETFs for total market exposure is not possible here.
| Tracking ETF | Symbol | MER | Underlying Index | Number of Companies | Dividend Yield |
|---|---|---|---|---|---|
| Vanguard Large-Cap ETF | VV | 0.05% | CRSP US Large Cap Index | 602 | 1.9% |
| Vanguard Small-Cap ETF | VB | 0.05% | CRSP US Small Cap Index | 1,388 | 1.6% |
| N/A | N/A | N/A | CRSP US Micro Cap Index | 1,692 | 1.2% |
However, Vanguard does provide a pair of U.S.-listed and Canadian-listed ETFs that follow the broader CRSP US Total Market Index, tracking the performance of over 3,600 companies – including these missing micro-cap stocks.
The Vanguard Total Stock Market ETF (VTI) trades on the U.S. stock exchange in U.S. dollars (similar to ITOT). When held in a tax-deferred account – such as an RRSP, LIRA, RRIF, or LIF – the usual 15% withholding tax on foreign dividends does not apply, saving investors about 0.26% per year in taxes.
Its sister ETF, the Vanguard U.S. Total Market Index ETF (VUN), trades on the Canadian stock exchange in Canadian dollars (similar to XUU). When held in a registered account, the 15% withholding tax on foreign dividends is lost, resulting in a tax drag of about 0.26% per year.
| ETF | Symbol | MER | Underlying Index | Number of Stocks | Dividend Yield |
|---|---|---|---|---|---|
| Vanguard Total Stock Market ETF | VTI | 0.04% | CRSP US Total Market Index | 3,602 | 1.8% |
| Vanguard U.S. Total Market Index ETF | VUN | 0.16% | CRSP US Total Market Index | 3,602 | 1.8% |
Again, remember that U.S.-listed ETFs like ITOT and VTI are only effective at reducing the foreign withholding tax drag in tax-deferred accounts such as RRSPs, LIRAs, RRIFs, and LIFs. Please refer to the end notes for a summary of the estimated foreign withholding tax drag when holding these ETFs in various account types.
So, we’ve now presented four basic single-fund choices for broadening your diversification by employing U.S. equity ETFs:
| Tracking ETF | Symbol | MER | Underlying Index | Number of Stocks | Dividend Yield |
|---|---|---|---|---|---|
| iShares Core S&P Total U.S. Stock Market ETF | ITOT | 0.03% | S&P Total Market Index | 3,825 | 1.8% |
| iShares Core S&P U.S. Total Market Index ETF | XUU | 0.07% | S&P Total Market Index | 3,825 | 1.8% |
| Vanguard Total Stock Market ETF | VTI | 0.04% | CRSP US Total Market Index | 3,602 | 1.8% |
| Vanguard U.S. Total Market Index ETF | VUN | 0.16% | CRSP US Total Market Index | 3,602 | 1.8% |
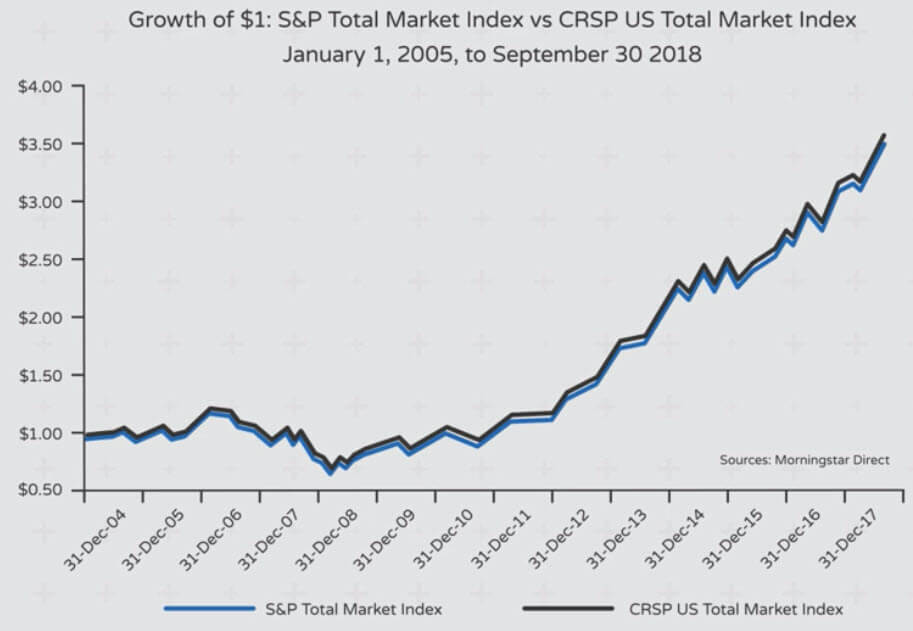
Since 2005, the performance difference between the S&P Total Market Index and the CRSP US Total Market Index has been minimal, so investors should feel confident that any of the four ETFs discussed will provide them with the returns of the broad U.S. stock market, as illustrated in the graph below:
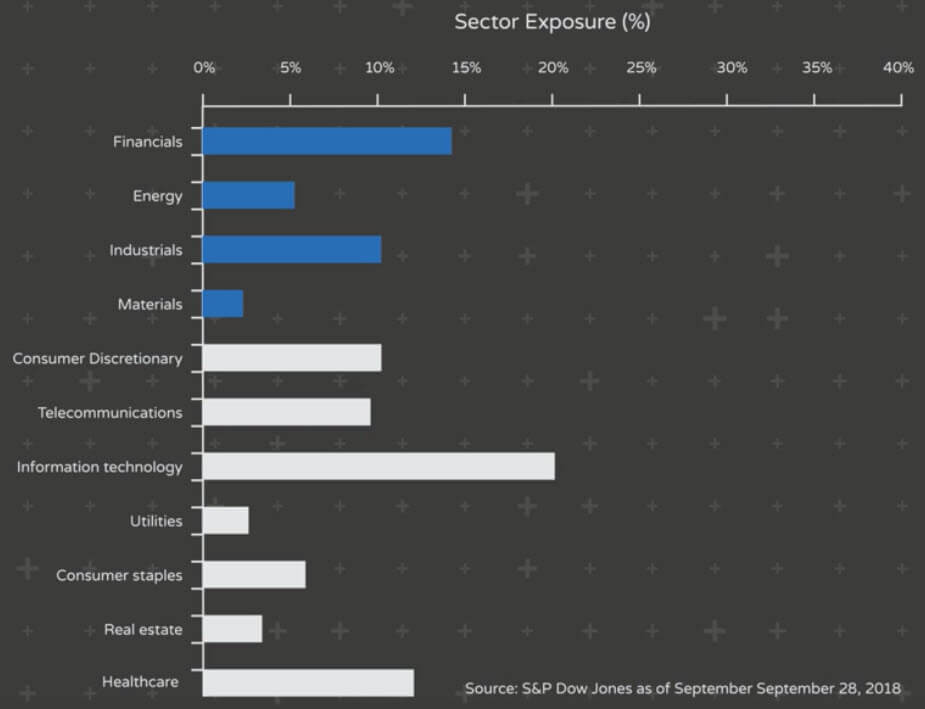
Before we wrap, let’s review why it might be worth adding in U.S. equity ETFs to begin with. In my last segment, Understanding Canadian Equity ETFs, I mentioned that nearly 75% of companies within broad-market Canadian equity ETFs were concentrated in the financial, energy, industrials and materials sectors. As shown in the chart below, the U.S. stock market is much more diversified across sectors, with only about a third of companies operating within these four sectors. By including an allocation to broad-market U.S. equity ETFs, Canadian investors can significantly increase the sector diversification within their overall portfolio.
If you’ve made it this far, though, you are now probably wondering about the rest of the world, i.e., international equities which exclude North American companies.
Good news: I’ll be covering that in my next “Understanding ETFs” presentation. Stay tuned!
—————————————————————————————————————-
End Notes: Estimated Unrecoverable Foreign Withholding Taxes: U.S. Equity ETFs
| Account Type | iShares Core S&P Total U.S. Stock Market ETF (ITOT) | iShares Core S&P U.S. Total Market Index ETF (XUU) | Vanguard Total Stock Market ETF (VTI) | Vanguard U.S. Total Market Index ETF (VUN) |
|---|---|---|---|---|
| Registered Retirement Savings Plan (RRSP) | 0.00% | 0.26% | 0.00% | 0.26% |
| Registered Retirement Income Fund (RRIF) | 0.00% | 0.26% | 0.00% | 0.26% |
| Locked-in Retirement Account (LIRA) | 0.00% | 0.26% | 0.00% | 0.26% |
| Locked-in Income Fund (LIF) | 0.00% | 0.26% | 0.00% | 0.26% |
| Tax-Free Savings Account (TFSA) | 0.26% | 0.26% | 0.26% | 0.26% |
| Registered Education Savings Plan (RESP) | 0.26% | 0.26% | 0.26% | 0.26% |
| Registered Disability Savings Plan (RDSP) | 0.26% | 0.26% | 0.26% | 0.26% |
| Taxable Accounts | 0.00% | 0.00% | 0.00% | 0.00% |
Sources: BlackRock Inc., The Vanguard Group, Inc., CRSP, S&P Dow Jones Indices as of September 28, 2018