The Vanguard FTSE Canadian Capped REIT Index ETF (ticker: VRE) has been a favourite of many passive investors for many years. As with the iShares S&P/TSX Capped REIT Index ETF (ticker: XRE), it proposes a market capitalization weighted exposure to the REIT sector, but at a much lower cost: VRE has a management expense ratio of 0.38%, compared to 0.61% for XRE. Since both ETFs track the Canadian REIT market, they should perform similarly, right? Not really. In fact, the recent performance of VRE has been disappointing when compared to that of XRE: VRE has underperformed XRE by a whopping 410 bps year-to-date!
Table 1: Year-to-Date Returns for VRE and XRE as of May 31, 2022


The main reason, as you would guess, is their difference in portfolio composition. VRE does not invest exclusively in REITs. Despite VRE’s name – Vanguard FTSE Canadian Capped REIT Index ETF – about 20% of the portfolio is not invested in REITs. In fact, VRE’s reference index is the FTSE Canada All Cap Real Estate Capped 25% Index, which includes corporations operating in the real estate sector. In contrast with REITs, real estate corporations are not bound to derive their revenues from property rents. Let’s look at the actual holdings of both ETFs, as provided on each ETF provider’s Website:
Table 2: VRE and XRE Portfolio Holdings[1]

Three of the largest securities held exclusively by VRE are corporations rather than REITs. Two of those three corporations do not hold a portfolio of real estate assets: Firstservice and Colliers basically sell real estate services. Tricon manages a real estate portfolio from which it derives most of its revenue. You will also note that there is a great many REITs that are part of XRE, but absent from the VRE portfolio.
The three corporate real estate stocks held by VRE have performed very poorly recently, as demonstrated by Table 3.
Table 3: Year-to-date Returns of the Corporation Holdings Held by VRE.


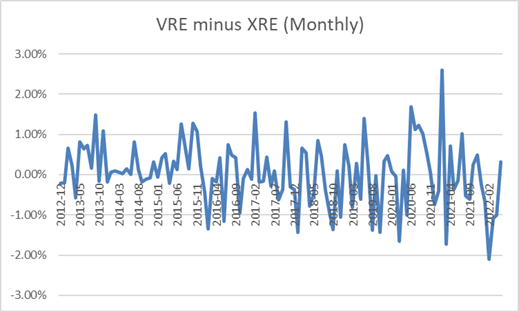
Let’s get back to VRE and XRE. Their returns have been very different recently. Is this new? No. There was always a difference between the holdings of XRE and VRE. This difference is very substantial, and it has been there since VRE’s day one (XRE was launched several years before VRE). As a result, VRE has often underperformed and overperformed XRE in several periods since 2012.
Chart 1: VRE vs. XRE – Difference in Monthly Returns Since 2012


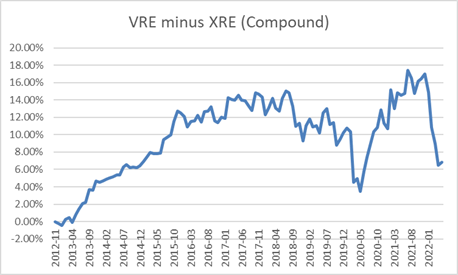
As depicted in Chart 1, the difference in monthly return has been quite volatile. Although VRE’s recent performance has been poor, investors have fared relatively well since its launch. Table 4 illustrates this difference: since December 2012, VRE has outperformed XRE by 0.42%. This difference may appear slim, but as depicted in Chart 2, VRE surpasses XRE by a compound 6% over the period.
Table 4: VRE vs. XRE – Annualized Return Since December 2012


Chart 2: VRE vs. XRE – Compound Difference in Returns Since 2012


There are major differences between the holdings of VRE and XRE. In contrast with XRE, VRE is not constrained to hold only REITs. The difference in holdings explains the recent underperformance of VRE, which is not unprecedented and is partly due to the poor performance of the three corporations that are included in the portfolio. The current underperformance may persist for a while, just like VRE has cumulatively outperformed by more than 14% from 2012 to 2016.
What should investors do? If your goal is to invest in the real estate sector, VRE is fine. If, on the other hand, you want to invest in securities that derive their revenues almost exclusively from property ownership, XRE may be a better choice, despite its higher cost.