According to the World Bank[i]: “Canada is home of the world’s most admired and successful public pension organizations.” Beath, Betermier, Flynn, and Spehner (2021)[ii] add: “From 2004 to 2018, Canada’s pension funds outperformed their peers in terms of investment performance and insurance against liability risks.” The nine largest Canadian public pension managers (“Big Nine” or “B9”)[iii] are responsible for assets totaling $2.1 trillion—similar to the combined amounts managed by the Canadian mutual fund and ETF industries.[iv] What are their common practices? How do they differentiate from one another? And what can individual investors learn from them?
This article provides twelve observations about the Big Nine, how they are organized, how they invest, and suggests what practices should and should not be adopted by individual investors.
According to Beath, Betermier, Flynn, and Spehner (2021), one key to the Canadian pension managers’ success is managing more assets internally to reduce their costs by approximately one-third and reallocate these savings to generate both higher returns and better risk management. In the end, their costs are modestly lower than those of their global peers, and their results are superior, in terms of both asset performance and liability hedging.
The B9’s missions and structures vary across three main axes:
a) HOOPP, OMERS and OTPP provide integrated pension administration and investment services, while the other managers provide only investment-related services, including investment management, risk management advisory services, and asset-liability management consulting.
b) Some of the managers, namely CDPQ, BC Investments, and AIMCO, serve dozens of client organizations with individual portfolios. These pension managers operate like a mutual fund company, providing their clients with a menu of asset class/strategy portfolios from which client organizations can pick and choose. By contrast, HOOPP and OMERs serve hundreds of employers under a unified pension portfolio and administrative structure. Finally, a third type of organization (CPP Investments, IMCO, OTPP, and PSPIB) serves a small number (between one and four) of pension plans with one or two complete portfolio solutions.
c) Lastly, the B9 all have the same investment mission to maximize risk-adjusted returns except for one. CDPQ has a dual mandate that includes contributing to Quebec’s economic development.
HOOPP is by far the B9 that outperformed its benchmark by the widest margin over ten years at 2.6%, while OMERS ranks last at 0.1%. In terms of absolute returns, CPP Investments has the top mark at 10% and AIMCO is last at 7.2%. Absolute returns must be compared with caution, as the B9 do not all share the same fiscal year-end. On average, the B9 returned 8.4% over ten years and outperformed their respective benchmarks by 1.2%.
Table 1 – Ten-Year Returns
| Fiscal Year End | 10 YR Return | Benchmark | Diff. | |
| AIMCO | 12/31/2022 | 7.2% | 6.5% | 0.7% |
| BCI | 3/31/2023 | 8.5% | 7.2% | 1.3% |
| CDPQ | 12/31/2022 | 8.0% | 7.0% | 1.0% |
| CPP Investments (Base CPP) | 3/31/2023 | 10.0% | 9.2% | 0.8% |
| HOOPP | 12/31/2022 | 8.4% | 5.7% | 2.6% |
| IMCO[v] | 12/31/2022 | NA | NA | NA |
| OMERS | 12/31/2022 | 7.5% | 7.4% | 0.1% |
| OTPP | 12/31/2022 | 8.5% | 7.5% | 0.9% |
| PSP Investments | 3/31/2023 | 9.2% | 7.4% | 1.8% |
| Average | 8.4% | 7.2% | 1.2% |
Source:Big Nine Annual Reports as of 12/31/2022 and 3/31/2023
“Fixed income” includes mostly government bonds, while credit instruments include corporate bonds and private debt. Six of the B9 invest 30% or less of their portfolio in fixed income and credit. BCI, OTPP and HOOPP hold higher allocations in this asset class, with the help of leverage.[vi] The boldest of the B9 from this perspective is HOOPP, allocating 96% of its net assets to fixed income and credit and 75% to other asset classes, for a total leverage of 71% (see the “funding” column in Table 2).
Table 2 – Asset Mix
| Funding | Money Market | Fixed Income | Credit | Public Equity | Private Equity | Real Estate | Infra & Resources | Hedge Funds | Others | Total | |
| AIMCO | 0% | 20% | 7% | 31% | 8% | 14% | 15% | 4% | 0% | 100% | |
| BCI | -8% | 0% | 30% | 10% | 28% | 13% | 17% | 10% | 0% | 0% | 100% |
| CDPQ | 0% | 8% | 21% | 25% | 20% | 12% | 14% | 0% | 0% | 100% | |
| CPP Investments | 0% | 12% | 13% | 24% | 33% | 9% | 9% | 0% | 0% | 100% | |
| HOOPP | -71% | 0% | 96% | 0% | 23% | 19% | 17% | 4% | 5% | 6% | 100% |
| IMCO | 2% | 20% | 9% | 25% | 8% | 17% | 12% | 7% | 0% | 100% | |
| OMERS | -8% | 0% | 8% | 21% | 23% | 18% | 17% | 21% | 0% | 0% | 100% |
| OTPP | -40% | 0% | 35% | 14% | 9% | 24% | 12% | 35% | 8% | 3% | 100% |
| PSP Investments | 3% | 19% | 11% | 22% | 15% | 13% | 17% | 0% | 1% | 100% | |
| Average | 1% | 28% | 12% | 23% | 18% | 14% | 15% | 3% | 1% | 100% |
Source: Big Nine Annual Reports as of 12/31/2022 and 3/31/2023
While PSP Investments has the highest allocation to cash (3%), most of the Big Nine held zero or close to zero cash at the end of their fiscal year. Since most of these organizations benefit from positive cash flow (contributions exceed benefits), their need to hold cash is minimal. The low level of cash also possibly reflects the belief that this asset class is not very productive for the purpose of long-term investing.
While Beath, Betermier, Flynn, and Spehner (2021) report a 7% allocation to hedge funds, we came up with an average of only 3%. While OTPP has a hefty weight in this asset class, five of the Big Nine do not declare any allocation to hedge funds in their annual report.
None of the B9 mention a significant allocation to cryptocurrencies in their annual report.
There are very few references to passive investments in the B9’s annual reports. The major exception is PSP Investments, which allocates 65% of its public equity holdings to passive funds.
The average MER[vii] for the B9 was 0.66% in 2022, down from 0.77% in 2021, due to lower performance-related fees on private investments. In dollars, the B9 cost of investment management totaled $15 billion in 2022. The lowest cost manager is HOOPP at 0.44%, and the most expensive is CPP Investments at 0.97%, as outlined in Table 3.
Table 3 – MER (Investment Costs)
| MER in % | In $Billion | |
| AIMCO | 0.63% | $1.0 |
| BCI | 0.53% | $1.1 |
| CDPQ | 0.48% | $2.0 |
| CPP Investments | 0.97% | $5.3 |
| HOOPP | 0.44% | $0.2 |
| IMCO | 0.70% | $0.8 |
| OMERS | 0.60% | $0.7 |
| OTPP | 0.78% | $1.9 |
| PSPI | 0.80% | $1.9 |
| B9 | 0.66% | $14.9 |
Source: Big Nine Annual Reports as of 12/31/2022 and 3/31/2023
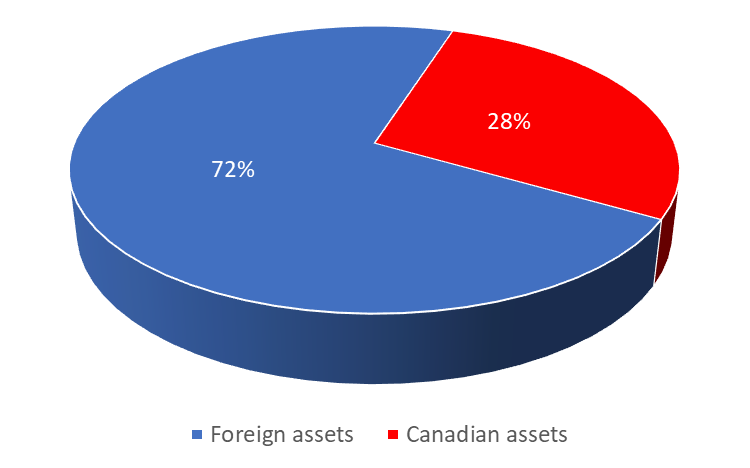
The Big Nine hold on average 72% of their portfolio in foreign markets, compared to only 28% in Canada. Their major involvement in private credit, private equity, global real estate, and infrastructure and resources, which are essentially international markets, partly explains this exposure. The most international of the B9 is CPP Investments (86%), and the least is AIMCO (57%).
Table 4 – Allocation to Foreign Assets
| AIMCO | 57% |
| BCI | 71% |
| CDPQ | 75% |
| CPP Investments | 86% |
| HOOPP* | NA |
| IMCO | 65% |
| OMERS | 76% |
| OTPP | 67% |
| PSP Investments | 76% |
| Average | 72% |
Source: Big Nine Annual Reports as of 12/31/2022 and 3/31/2023
Figure 1- Overall Foreign Allocation

Source: Big Nine Annual Reports as of 12/31/2022 and 3/31/2023
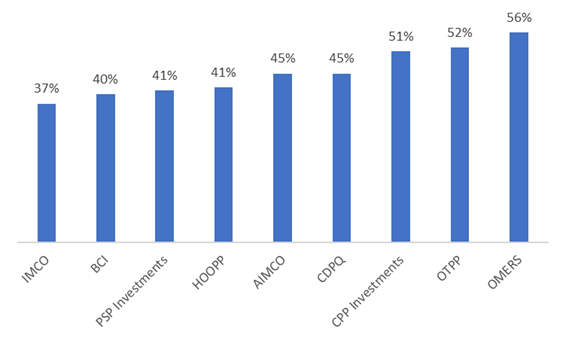
Allocations to private markets range between 37% (IMCO) and 56% (OMERS). These percentages exclude private credit, as this asset class is sometimes not segregated from public market credit in annual reports. Thus, our reported allocations to private markets underestimate the actual figures.
Figure 2 – Allocations to Private Investments – Excluding Private Credit

Source: Big Nine Annual Reports as of 12/31/2022 and 3/31/2023
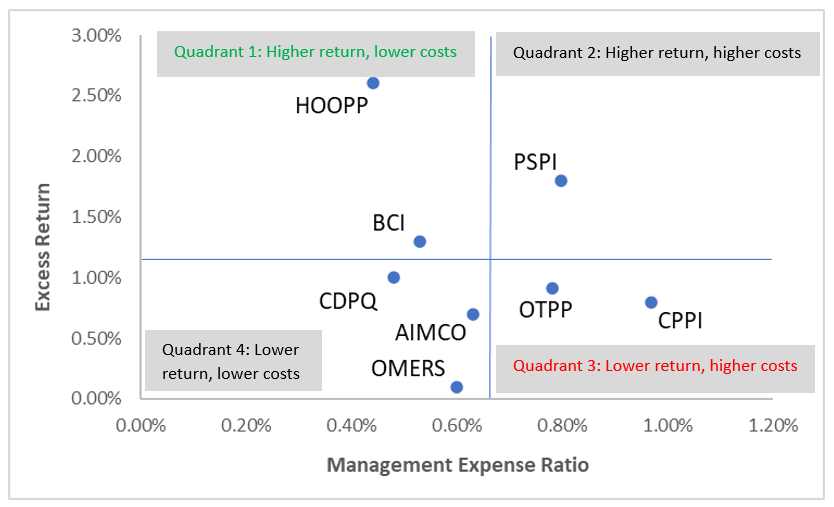
Figure 3 below is separated into four quadrants. “Quadrant 1” displays the high-performing managers with both higher-than-average excess returns and lower-than-average MERs. HOOPP is, at the same time, the highest performer (in terms of excess return over benchmark) and has the lowest cost. BCI is also in the high-return/low-cost category. CPPI and OTPP produced, by contrast, lower-than-average excess returns and higher-than-average costs than their peers. It is important to notice, though, that CPPI had the highest absolute return among the Big Nine (see Table 1). However, we attach greater importance to relative return than to absolute return because the latter results more from investment policy than from successful portfolio management.
Figure 3 – 10-year Excess Return over Benchmark vs. MER
Source: Big Nine Annual Reports as of 12/31/2022 and 3/31/2023
We believe that individual investors should adopt some of the practices of the Big Nine and avoid others. Here’s our list.
On average, the Big Nine hold a 1% allocation to cash. Individual investors should hold no more cash than required by their current liquidity needs. This means, in general, that investors who are in their accumulation phase should keep cash to less than 2%, while retirees must hold enough to cover their income needs. This does not account for the emergency fund, which we distinguish from the long-term investment portfolio.
Cash is a low-return asset class. According to Dimson, Marsh and Staunton, US Treasury Bills provided a real return of only 0.7% from 1900 to 2022, compared to 1.7% and 5.2% for global fixed income and global equity.[viii]
All but one of the Big Nine (HOOPP does not disclose its allocation to foreign investments) invest most of their assets outside of Canada, and rightly so. It has been advocated that cross-country correlations have increased in the last few years, leading some investors to lose faith in international diversification. While it may be true, there is a flaw in this reasoning: correlations of monthly returns measure the short-term benefits of international diversification. But for long-term investors, it is long-term risks that matter. The biggest threat to long-term investors is to be concentrated in a market that underperforms persistently as Japan has done since 1990.
Anarkulova, Cederburg, and O’Doherty (2023)[ix] created a comprehensive dataset of 38 developed country markets from 1841 to 2019. Using advanced simulation techniques, they found that a single-country stock portfolio has a 13% likelihood of producing a negative real return over thirty years, compared to only 4% for a global portfolio. In a nutshell, unless an investor can reliably forecast which country markets will outperform in the future (no one can), international diversification of equity portfolios is a best practice.
According to our data, the Big Nine are not investing on a large scale with hedge funds. This is likely based on the poor historical performance of this asset class. It is safe to assume that if these large pension managers, which have a large amount of capital and human resources at their disposal, are not investing, then it seems that individuals should also avoid this type of investment.
According to our readings, the Big Nines’ annual reports do not report any cryptocurrency holdings in their portfolios. It is safe to say that crypto likely doesn’t belong in individuals’ portfolios as well.
The Big Nine manage 80% of their assets internally, which means they mostly select securities themselves. Most individual investors do not have the means to achieve optimal diversification with individual security selection. They will be better served with broadly diversified investment funds.
Most of the Big Nine (PSPI being the exception) do not mention much investing with passive funds. In contrast with individual investors, the B9 possibly have the skills and bargaining power to hire successful active portfolio managers at a low cost. Individual investors do not have this competitive advantage.
According to Berk & van Binsbergen (2015),[x] stock-picking skill does exist, but only for a few mutual fund managers. Moreover, investors reward high-performing managers by sending them more money to manage, incurring higher fees. The authors highlighted that in the end, investors earn zero alpha net of fees. In their own words: “…managers [rather than investors] are able to capture all economic rents themselves.”
Under such circumstances, investors are better off investing in the market portfolio (passive funds), considering the high risk of selecting managers who will underperform.[xi]
Since the Big Nine invest massively in private assets, shouldn’t individual investors do the same? According to a recent survey by RBC Investor Services,[xii] investing in private asset funds is feasible for individual investors, and the availability of such funds is likely to grow.
When investing in private markets, large institutional investment organizations have overwhelming advantages over wealthy individual investors. They can reduce the cost of private investments by internalizing part of it. For example, CDPQ and OMERS have subsidiaries fully dedicated to acquiring and managing private real estate and infrastructure. In the private equity market, they do co-investments: they invest in high-cost private equity funds, AND, at the same time, they invest directly in some of the portfolio companies of these funds. This allows pension managers to save on costs, as they do not pay management fees to fund managers for directly owned assets. Secondly, co-investing provides them with detailed information about the private assets owned by the funds they invest in. With their vast internal resources, they can perform a full expert review of these assets before investing.
Individual investors do not have the cost advantage, the resources, or the access to information required to perform the type of due diligence on private investment funds that the B9 can do. To summarize, private investment funds are too expensive, too risky, and opaque to provide a decent chance of outperforming a public equity portfolio. For individual investors, a viable alternative is to invest in small-cap ETFs, which can be expected to provide a similar or better outcome to private equity without its cost and transparency concerns.[xiii]
In the last decade, the Big Nine have partly replaced fixed income with other high revenue-generating assets, such as private lending, private real estate, and private infrastructure. This strategy was highlighted by spectacular transactions, such as CDPQ’s $5 billion investment in the Dubai Port Authority.[xiv] Since individuals do not have access to these asset classes under the same advantageous conditions, we believe a greater allocation to fixed income is necessary, subject to each investor’s particular circumstances.
The Big Nine Canadian pension managers are cited as an example for their global peers. This paper highlights several of their investment practices. One key finding is that the highest-cost organizations do not perform best; on the contrary, the best relative return is achieved by the lowest-cost organization (HOOPP). We also differentiate the investment practices of the B9 that will likely benefit investors from those that will not. Some findings were surprising, such as the Big Nine’s minimal (and often zero) allocation to hedge funds, which we believe individual investors should emulate. However, many of the strategies adopted by the Big Nine are likely not appropriate for individuals. Investors must be selective when considering which of the B9’s investment practices to adopt.
[i] World Bank Group (2018), The Evolution of the Canadian Pension Model: Practical Lessons for Building World-class Pension Organizations. https://documents1.worldbank.org/curated/en/780721510639698502/pdf/121375-The-Evolution-of-the-Canadian-Pension-Model-All-Pages-Final-Low-Res-9-10-2018.pdf
[ii] Beath, A. D., Betermier, S., Flynn, C., Spehner, Q. (2021, March). The Canadian Pension Fund Model: A quantitative portrait. The Journal of Portfolio Management. https://www.pm-research.com/content/iijpormgmt/early/2021/03/01/jpm20211226
[iii] Sources: Annual reports from Alberta Investment Management Corporation (AIMCO), British Columbia Investment Management Corporation (BCI), Caisse de Dépôt et Placement du Québec (CDPQ), Canada Pension Plan Investments (CPPI), Healthcare of Ontario Pension Plan (HOOPP), Investment Management Corporation of Ontario (IMCO), Ontario Municipal Employees’ Retirement System (OMERS), Ontario Teachers’ Pension Plan (OTPP), and PSP Investments (PSPI).
[iv] Source: IFIC (2023), 2022 Investment Funds Report. https://www.ific.ca/wp-content/themes/ific-new/util/downloads_new.php?id=28046&lang=en_CA
[v] IMCO was founded recently and does not have ten years of returns history.
[vi] Some pension managers borrow money to increase their exposure to specific asset classes.
[vii] Our definition of “MER” includes investment-related operating costs and all other investment costs except the (interest) cost of debt.
[viii] In US dollars. Source: Dimson, E., Marsh, P., Staunton, M. (2022). Credit Suisse Global Investment Returns Yearbook 2022 Summary Edition. https://www.credit-suisse.com/about-us-news/en/articles/media-releases/credit-suisse-global-investment-returns-yearbook-2022-202202.html
[ix] Anarkulova, A., Cederburg, S., O’Doherty, M. S. (2021). Long-horizon losses in stocks, bonds, and bills. SSRN. https://papers.ssrn.com/sol3/papers.cfm?abstract_id=3964908
[x] Berk, J., van BinsBergen, J. (2015), Measuring skill in the mutual fund industry, Journal of Financial Economics, https://doi.org/10.1016/j.jfineco.2015.05.002
[xi] Ganti, A., Di Gioia, D, Nelesen, J., Stoddart G. (2023), SPIVA Canada Mid-Year 2023, S&P Dow Jones Indices, https://www.spglobal.com/spdji/en/spiva/article/spiva-canada
[xii] RBC Investor Services (2023), Searching for the new “modus operandi”: 2023 Asset & Wealth Management Survey. https://www.rbcits.com/en/insights/2023/07/charting_the_course_for_change
[xiii] Boyer, B., Nadauld, T., Vorkink, K., Weisbach, M. (2021). Discount Rate Risk in Private Equity: Evidence from Secondary Market Transactions, NBER. https://doi.org/10.3386/w28691
[xiv] Matthew, S. (2022), Caisse de Depot to invest US$5B in Dubai port operator, BNN Bloomberg. https://www.bnnbloomberg.ca/canada-fund-cdpq-to-invest-5-billion-in-dp-world-s-dubai-assets-1.1774940