Sorry to ruin the suspense, but here’s my answer to whether I think market-timing ever works: No. I’ve looked at an overwhelming amount of evidence, and I have yet to find a rational reason for trying to dodge in and out of the market. Even if your timing attempts are based on assessments that the market is under-, over-, or fairly priced, all the evidence I’ve seen suggests: Market-timing is far more likely to hurt than help you.
Still, even the most rational index investors might catch themselves wondering about it anyway. When markets seem scary and volatile, it’s always tempting to sell your equities. It’s equally tempting to want to get in on the action when there are reports of record-high stock prices.
This is in large part due to our many behavioral biases: loss aversion, overconfidence, tracking-error regret, and so on. One of my favorites is confirmation bias. Say you manage once to get in or out of the market just ahead of a big rise or fall. Despite the very high likelihood your timing was luck vs. skill, your brain will tell you otherwise. This might increase your future impulse to do it again – and next time, you may not be so lucky.
Bottom line, succumbing to your behavioral biases is not a good way to make financial decisions. Instead, we should look at the data to see if market-timing is a viable strategy. Unfortunately, even then, we face a challenge. Interpret the data incorrectly, and you can still do yourself a disservice. Let me show you what I mean.
There actually is data showing that when markets are expensive, future returns tend to be lower. If we know when stock prices are high relative to the past, why can’t we determine we should get out of the market, or at least not put new money in?
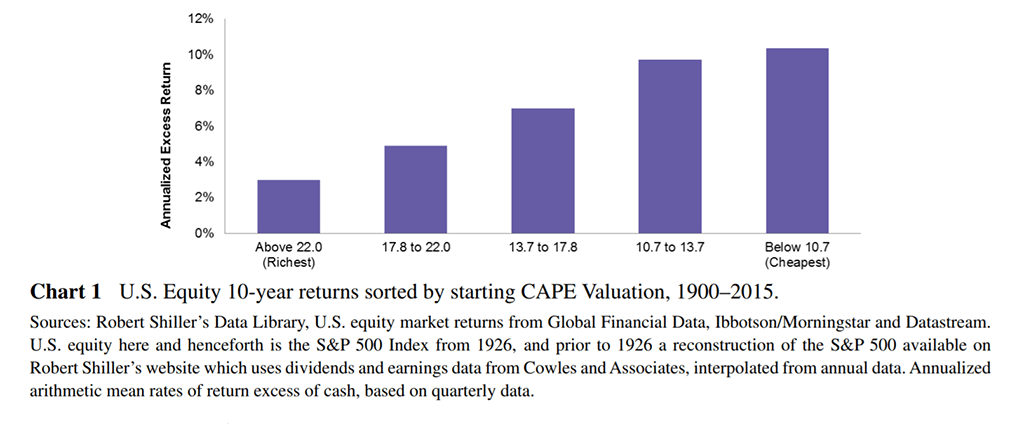
The most reliable metric we have for forecasting future returns is the Shiller CAPE ratio (or the Cyclically Adjusted Price Earnings ratio). If we look at market history, periods of high prices have often been followed by lower returns. Chart 1 is from an AQR Capital Management paper, “Market Timing: Sin a Little.” It shows the annualized excess returns for stocks, sorted quarterly based on CAPE ratio valuations. We can see that the most expensive stocks in the far-left bar had substantially lower 10-year future returns than the least expensive stocks in the far-right bar. There is clearly a relationship between current valuation and future returns.
Does this mean you should engage in market-timing if the data shows that stocks are cheap or expensive? I can assure you, it does not.
Perhaps the biggest problem here is that the data we just saw has built-in hindsight bias. Think about it. This chart has sorted stocks based on their quarterly valuation during an entire 1900–2015 timeframe. That’s cheating. A real investor in 1955 could no more know what 2015 valuations were going to be than we, in 2019, can tell what to expect in 2079. Stocks may look expensive today relative to past returns. But relative to unobservable future returns, who knows? They may end up looking cheap.
In other words, there’s no way to see this helpful, valuation-sorted data except in hindsight. This causes an obvious problem for market-timers.
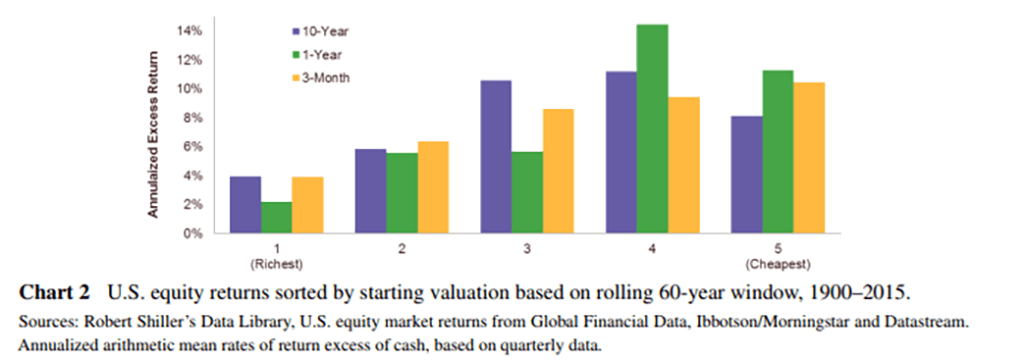
In the same AQR paper, its authors adjusted for the hindsight bias by sorting stocks based on data points representing “snapshots” of rolling 60-year returns (see Chart 2).
Without getting too technical, this method gives us results that are much closer to what a real, non-time-traveling investor could actually see. The results in this case are much weaker. There is still a trend toward lower future returns when stocks are most expensive, but it is much less obvious than when we have perfect foresight.
And yet, even though it’s weak, there is still a relationship. When stocks are expensive relative to the past, future returns tend to be lower. The real question, though, is whether or not you can use this information to make better investment decisions.
The AQR paper also asked this question. To address it, they built a market-timing strategy that adjusted the weight in stocks based on valuations, and tested the strategy on data from 1900–2015. For the full sample, the timing strategy did add value to returns, but it underperformed from 1958–2015. The paper suggests this may be due to stocks becoming more or less cheap for very long periods of time.
In other words, from 1900–1957, stocks were generally cheap relative to their past prices, causing AQR’s valuations-based timing strategy to invest 100% in stocks. From 1958–2015, stocks were generally expensive relative to the past, so the strategy ended up underinvesting in stocks for most of the period. The paper sums up the exercise as follows:
“Valuations can drift higher or lower for years or decades, making it difficult to categorize the current market confidently as ‘cheap’ or ‘expensive’ without hindsight calibration, and therefore difficult to profit from such categorizations.”
There are other challenges when trying to use signals like the Shiller CAPE ratio to time the market. For one, even after a signal may suggest lower returns are coming, there may still be higher returns coming first. There is evidence that when stocks have been increasing in price, they tend to continue on that trajectory for some time. In physics and finance alike, this familiar “body in motion” phenomenon is called momentum. Stocks will start to look expensive based on metrics like the Shiller CAPE ratio because they have been going up in price. But if you sell when CAPE ratios are rising, you are betting against the power of momentum.
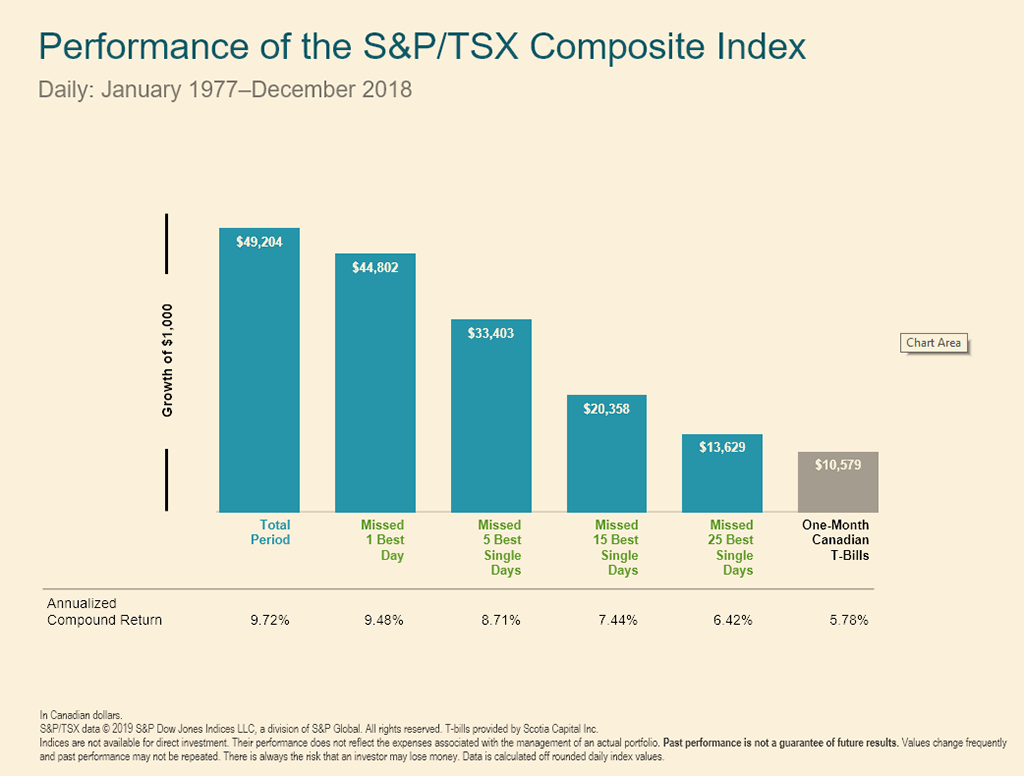
We also have to remember that most of the market’s returns come with wild unpredictability during a relatively small number of trading days. Consider the S&P/TSX Composite index data in Chart 3. From 1977–2018, the index returned 9.72%. If you omit the single best trading day over that full time period, the annualized return drops to 9.48%. If you miss the 15 best days, the annualized return drops to 7.44%! That’s more than a two-point drop in annualized returns for missing a tiny fraction of the total trading days.
Now, the probability of missing the 15 best days may not be any higher than the probability of missing the 15 worst days, so this is an extreme example. But the point is, you have to stay in the market if you want to earn market returns.
Even for the most rational investors, I think one of the most tempting times to engage in market-timing is when you’ve got a lump sum of cash to invest. It’s scary to think about how the value of your cash could drop substantially the day after you invest it, especially if markets feel uncertain.
Let me tell you something I have learned after having hundreds of conversations like this: The markets always feel uncertain.
Many people use dollar-cost averaging to dampen their doubts. Instead of investing a $100,000 lump sum today, you invest $10,000/month over the next 10 months. This alleviates concerns over ending up investing at the worst possible time. Unfortunately, that is about all it does.
I’ll grant you, dollar-cost averaging is systematic. If you are nervously sitting on investable cash, and dollar-cost averaging is the only way you can convince yourself to invest, I do think that’s better than remaining fully on the sidelines awaiting the perfect moment. Still it is statistically suboptimal and, at the end of the day, it is still a form of market-timing. If you use it, do so assuming it is unlikely to give you a better result on average than investing your lump sum of cash right now.
Vanguard studied this in a 2012 paper, Dollar-cost averaging just means taking risk later. They tested lump-sum investing against dollar-cost averaging over 12-month periods, looking at U.S. markets from 1926–2011, U.K. markets from 1976–2011, and Australian markets from 1984–2011 (based on available data from each). In all geographic regions tested across stocks, bonds, and a 60/40 stock/bond balanced portfolio, Vanguard found lump-sum investing beat dollar-cost averaging roughly two-thirds of the time.
As we have seen, there is a relationship between current market valuations observed by the Shiller CAPE ratio, and expected future returns. As tempting as it may be to use this information to make market-timing decisions, I think I’ve also shown why the relationship is not reliable enough to serve this purpose. Maybe expert intuition alone might work? Here’s what Nobel Laureate Daniel Kahneman told the 71st CFA Institute Annual Conference:
“It’s very difficult to imagine from the psychological analysis of what expertise is that you can develop true expertise in, say, predicting the stock market. You cannot because the world isn’t sufficiently regular for people to learn rules.”
Bottom line, market-timing is hard. It’s the equivalent of stacking the odds against rather than for your preferred outcome. You have to get out of the market at the right time, which is hard to do even with the most reliable forecasting metric available. Then you have to get back in at the right time. If you miss either “right time” windows by just a few good days, you can seriously hurt your long-term returns – and that’s before we even consider trade costs and tax ramifications.
In his classic book, Common Sense on Mutual Funds, Vanguard’s legendary founder, the late John Bogle, famously said this about market-timing:
“After nearly 50 years in this business, I do not know of anybody who has done it successfully and consistently. I don’t even know anybody who knows anybody who has done it successfully and consistently.”
What do you think? Have I convinced you that you’re better off if you don’t try to time the market? Please spread the word by sharing this video with others who could benefit from the information. You also can tune in and point your friends to our Rational Reminder Podcasts while you’re at it.


