Andrew Hallam wrote a post in 2018 assessing the performance of Dimensional Fund Advisors funds against what he proposed as comparable Vanguard funds. Hallam is not the first person to attempt this analysis. His results, from 2007 through April 2018 show that Dimensional and Vanguard had been very close, but Vanguard had the edge in terms of returns and risk-adjusted returns.
Unfortunately, Hallam did not seem to realize that he was not comparing apples to apples. It is widely understood that exposure to known risk factors drives expected stock returns. While similar in name, the Dimensional and Vanguard funds in Hallam’s comparison do not have the same risk factor exposures, or even the same asset allocation.
In this post we will re-create similar analysis to Hallam, but we will address the differences in factor exposure and asset allocation. We are excluding the International and Emerging Markets portion of the portfolio because those asset classes are harder to perform factor regression on; we are only looking at US equities here.
Using portfoliovisualizer.com we will start with two model portfolios, identical to the US equity component of Hallam’s model portfolio.
The Dimensional portfolio (Portfolio 1):
| Ticker | Name | Allocation |
| DFSVX | DFA US Small Cap Value I | 25.00% |
| DFSTX | DFA US Small Cap I | 25.00% |
| DFLVX | DFA US Large Cap Value I | 25.00% |
| DFUSX | DFA US Large Company I | 25.00% |
And the Vanguard portfolio (Portfolio 2):
| Ticker | Name | Allocation |
| VISVX | Vanguard Small Cap Value Index | 25.00% |
| VSMAX | Vanguard Small Cap Index | 25.00% |
| VVIAX | Vanguard Value Index | 25.00% |
| VFIAX | Vanguard 500 Index | 25.00% |
From January 2007 through April 2019, the Vanguard portfolio presented here has handily beaten the Dimensional portfolio by a substantial margin while also taking on less risk, as measured by standard deviation.
| Annualized Return | Annualized Standard Deviation | Sharpe Ratio | |
| Dimensional | 6.53% | 18.16% | 0.39 |
| Vanguard | 7.19% | 16.68% | 0.45 |
| Variance | -0.66% | 1.48% | -0.06 |
The problem is that we are comparing two very different portfolios. The Dimensional funds have substantially more exposure to the size and value risk factors than the comparable Vanguard funds.
This is best observed through a five-factor regression using the Fama-French regression factors. A higher regression coefficient indicates more exposure to that risk factor.
| Market | Size | Value | Profitability | Investment | |
| Dimensional | 1.05 | 0.39 | 0.21 | 0.04 | 0.05 |
| Vanguard | 1.01 | 0.23 | 0.15 | 0.03 | 0.04 |
| Variance | 0.04 | 0.16 | 0.06 | 0.01 | 0.01 |
Clearly the Dimensional portfolio has more exposure to the size and value factors than the Vanguard portfolio. This is a good thing if you want factor exposure, but it may seem like a bad thing when the risk factors do not pay off. Over this time period, US small cap was fairly muted while US value underperformed US growth by a meaningful amount.
| Market | Size | Value | Profitability | Investment | |
| US Factor Premia 01/2007 – 04/2019 | 7.77% | 0.27% | -3.38% | 3.27% | -0.55% |
If we correct for the level of factor exposure by adjusting the weights of the Vanguard funds used in the analysis, the performance gap narrows.
Risk-factor Adjusted Vanguard Portfolio (Portfolio 3):
| Ticker | Name | Allocation |
| VISVX | Vanguard Small Cap Value Index | 44.71% |
| VSMAX | Vanguard Small Cap Index | 28.82% |
| VVIAX | Vanguard Value Index | 20.65% |
| VFIAX | Vanguard 500 Index | 5.82% |
With these adjustments the factor exposure of the two portfolios is near-identical, and the performance gap narrows, though it does still favour Vanguard.
| Annualized Return | Annualized Standard Deviation | Sharpe Ratio | |
| Dimensional | 6.53% | 18.16% | 0.39 |
| Vanguard | 7.04% | 17.70% | 0.43 |
| Variance | -0.51% | 0.46% | -0.04 |
Different levels of exposure to risk factors is only part of the problem with comparing Dimensional to Vanguard. The other component is the fact that the funds have entirely different asset allocations. They are both US equity funds, but Dimensional does not include real estate securities in their equity portfolios because they distort exposure to the known risk factors. Instead, Dimensional has a separate REIT product.
The result of this difference in our comparison is that we are comparing a Vanguard portfolio with a 7.50% allocation to real estate to a Dimensional portfolio with a less than 1% allocation to real estate (according to Morningstar).
Correcting for this by adding the Dimensional REIT product back in allows us to compare portfolios with similar risk factor exposures and similar asset class allocations.
Adjusted Dimensional portfolio (Portfolio 4):
| Ticker | Name | Allocation |
| DFSVX | DFA US Small Cap Value I | 23.20% |
| DFSTX | DFA US Small Cap I | 23.20% |
| DFLVX | DFA US Large Cap Value I | 23.20% |
| DFUSX | DFA US Large Company I | 23.20% |
| DFREX | DFA Real Estate Securities Portfolio | 7.20% |
While important for a useful comparison, adding back REIT exposure does not materially affect the outcome over this time period.
| Annualized Return | Annualized Standard Deviation | Sharpe Ratio | |
| Dimensional | 6.51% | 18.15% | 0.39 |
| Vanguard | 7.04% | 17.70% | 0.43 |
| Variance | -0.53% | 0.45% | -0.04 |
The final component of this analysis is gathering more historical data to analyze. It is worth noting that over this longer period, the performance of real estate plays a meaningful role in the performance of the two portfolios. Leaving real estate out of the Dimensional portfolio would result in a substantial disadvantage due to the different asset allocations.
Going back to 2007 is interesting, but as we saw above the factor premiums for size and value were relatively tame over that time period. If we push the time period back as far as possible – January 2001 in this case, based on product availability – the results are compelling in favour of Dimensional’s ability to implement a factor-tilted portfolio.
| Market | Size | Value | Profitability | Investment | |
| US Factor Premia 01/2001 – 04/2019 | 5.63% | 3.27% | 0.57% | 3.94% | 1.49% |
Over this time period the Dimensional portfolio corrected for REIT exposure (Portfolio 4) beat the Vanguard portfolio corrected for factor exposure (Portfolio 3) in terms of both annualized return and risk-adjusted return.
| Annualized Return | Annualized Standard Deviation | Sharpe Ratio | |
| Dimensional | 8.35% | 17.16% | 0.47 |
| Vanguard | 8.02% | 17.03% | 0.46 |
| Variance | 0.33% | 0.13% | 0.01 |
One of the most interesting aspects of this analysis is that despite the similar factor exposures and asset allocations for these two portfolios, Dimensional still beats Vanguard in this period of relatively strong factor premiums. It is similarly interesting that Dimensional still trailed Vanguard in the initial time period despite the correction for asset class and risk exposure.
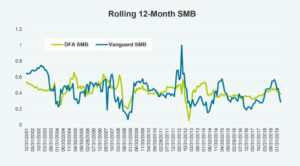
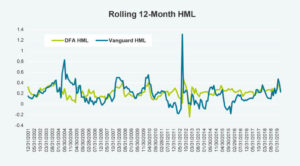
We believe that the explanation lies in the fact that Dimensional implements their funds daily to target factor exposure, while Vanguard tracks third-party indexes which reconstitute less frequently. This shows up in the 12-month rolling regression for the two portfolios. In simple terms, the rolling regressions allow us to see how consistent exposure to each factor has been over time. Notably, the average factor exposures over the full period have been similar, but the variability of the factor exposures have been higher across the board for the Vanguard funds.
The largest differences can be seen in the standard deviation of the size and value factor exposures. Dimensional maintained an average regression coefficient of 0.42 for size (SMB), and 0.22 for value (HML), while Vanguard had regression coefficients of 0.42 for size and 0.19 for value. In both cases the exposure was nearly identical. However, the rolling 12-month regression coefficients varied more over time for the Vanguard portfolio. The standard deviation of the rolling 12-month size exposure was 0.09 for Dimensional and 0.15 for Vanguard; for value exposure it was 0.09 for Dimensional and 0.18 for Vanguard. The increased variability is easily observed in the following charts.


Dimensional and Vanguard make for an obvious comparison: they are both giants in the world of index investing with strong track records and low fees. The challenge is that they are completely different products. Vanguard is tracking third-party indexes which reconstitute at set intervals, while Dimensional is targeting specific risk factors in portfolios on a daily basis. Comparing them is interesting, but the result of the comparison will rely solely on the magnitude of factor premiums over a given time period.
If capturing the factors that explain differences in stock returns is the goal, Dimensional has the optimal solution. If minimizing costs while tracking an index is the goal, Vanguard is the better choice.