
“Money grows on the tree of persistence.”
– Japanese proverb
Nominal return data provides insight into the psychological challenges of investing for the long term. We humans get excited when markets appreciate sharply and discouraged when they collapse, often failing to account for inflation. Yet real, inflation‑adjusted returns are the true economic yardstick of value creation. This article looks at the cycles for equity market real returns and their effect on the value created by several equity and fixed-income securities mixes, all from a Canadian investor’s perspective.
We follow the same methodology as our previous piece on nominal return cycles, except that monthly total returns are deflated using the Canadian All-items Consumer Price Index. The fixed income portfolio is invested in the total Canadian bond market, while the global equity market portfolio is 30% Canadian stocks and 70% Global ex-Canada markets. Management fees and foreign withholding taxes are subtracted from returns to better simulate an actual investor’s experience.
From 1970 to 2024, the average monthly real return was 0.49% for global equity, with a minimum of -18.4% (in October 1987) and a maximum of 14.8% (in January 1975). Real returns were positive in 59% of the months, a bit lower than the same metric for nominal returns (64%).
Real returns, volatility, and the compound value of one dollar invested in various asset mixes are displayed in Table 1.
Table 1 – Portfolio Real Return, Volatility, and Compound Value 1970–2024
| Portfolio | Annualized Real Return | Volatility | Final Real Value of $1 invested in January 1970 |
| Fixed Income | 3.32% | 5.94% | $6.03 |
| 40EQ60FI | 4.27% | 6.98% | $9.97 |
| 60EQ40FI | 4.65% | 8.66% | $12.15 |
| 80EQ20FI | 4.95% | 10.68% | $14.28 |
| Global Equity | 5.19% | 12.88% | $16.17 |
Source: PWL Capital; Data source: DFA
The results are remarkable.
The fixed income portfolio had a very high real return of 3.3% over 55 years. This compares with an average return for global government bonds from 1900 to 2024 of only 1.5%.[1] This elevated bond return is due to relatively high bond yields in the 1970s and early 1980s, followed by a steady decline of both inflation and bond yields from 1982 to 2022. A simultaneous decline of bond yields and inflation generated massive capital gains, driving high real returns. The presence of corporate and provincial bonds in the index, which introduce a credit premium, also explains the difference. Still, investors should not expect this type of real return for fixed income in the future.
The real equity return is identical to the 125‑year return documented by the research, at 5.2%. After 55 years, one dollar initially invested in the equity portfolio was multiplied by 16. Similarly to what we found with nominal returns, a 60/40 portfolio produced twice as much value as fixed income ($12 compared to $6), and a 100% global equity produced 2.7 times the final value of fixed income ($16 compared to $6).
Table 2 reports the value of a dollar invested in early 1970 after 10, 20, 30, 40, 50, and 55 years for each asset mix. The numbers in green signal the portfolios that gained inflation‑adjusted value in the previous decade, and those in red point to a loss. Once again, the results are very disparate.
In the 1970s, all portfolios ended the decade close to where they started. The 1980s and 1990s were very lucrative for all portfolios. The 60EQ40FI, for example, would have quintupled its real dollar value in those 20 years! The 2000s were positive for bond-heavy portfolios and negative for portfolios with high equity allocations. The 2010s were positive for all portfolios, especially those holding heavy weights in equity. The first half of the 2020s was negative for fixed income and positive for all other portfolios. Lastly, the 40EQ60FI and 60EQ40FI portfolios did not experience any “red periods” over the 55 years under study.
Table 2 – Real Value of $1 Invested in 1970 by Decade
| Date | Fixed Income | 40EQ60FI | 60EQ40FI | 80EQ20FI | Global Equity |
| 01/01/1970 | $1.00 | $1.00 | $1.00 | $1.00 | $1.00 |
| 12/31/1979 | $0.96 | $1.00 | $1.00 | $1.01 | $1.00 |
| 12/31/1989 | $1.76 | $2.14 | $2.31 | $2.45 | $2.56 |
| 12/31/1999 | $3.64 | $4.90 | $5.50 | $6.04 | $6.48 |
| 12/31/2009 | $5.54 | $5.89 | $5.81 | $5.57 | $5.17 |
| 12/31/2019 | $6.93 | $9.25 | $10.17 | $10.80 | $11.08 |
| 12/31/2024 | $6.03 | $9.97 | $12.15 | $14.28 | $16.17 |
Source: PWL Capital; Data source: DFA
Table 3 shows how global equity performed in real bear markets or drawdown periods with real returns of -20% or less.
Table 3 – Profile of Equity Bear Markets Based on Real Returns
| Contraction Start Date | Contraction End Date | Contraction Duration (months) | Contraction Return |
| 1969-12-31 | 1970-06-30 | 6 | -23% |
| 1973-01-31 | 1974-09-30 | 20 | -48% |
| 1980-11-30 | 1982-07-31 | 20 | -36% |
| 1987-08-31 | 1990-09-30 | 37 | -29% |
| 2000-08-31 | 2003-03-31 | 31 | -47% |
| 2021-12-31 | 2022-09-30 | 9 | -22% |
| Average | 21 | -34% | |
| Sum | 123 | ||
| Percentage of Months | 19% |
Source: PWL Capital; Data source: DFA
The worst bear markets were associated with the 1973–74 oil embargo and the 2000–03 post-dot-com bubble period, with real negative returns of nearly -50%. The 2007–09 period does not appear in this table because, in real dollar terms, the financial crisis was a mere continuation of 2000–03. As illustrated in Figure 1, the market bottomed in 2003, but did not fully recover before 2008. Since the crash of ’08 was not preceded by a complete recovery, it shows as a continuation of the 2000–03 bear market.
Figure 1 – Real Value of $1 Invested in Global Equity 2000–2009
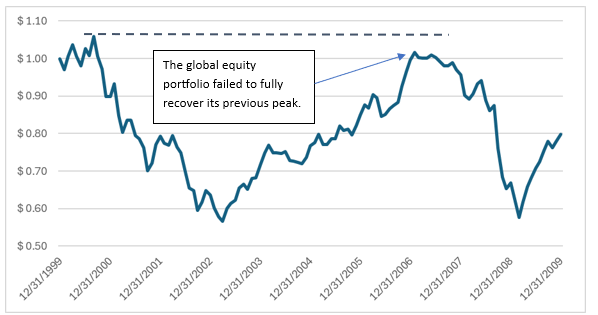
Source: PWL Capital; Data source: DFA
Table 3 shows a bear market in 2022 that was absent from our analysis of nominal returns. The Canadian Consumer Price Index spiked to 6.2% that year, making negative returns far more dramatic on an inflation-adjusted basis.
We report six bear markets over 55 years, with an average return of -34%. Real return bear markets lasted an average of 21 months (compared to only 14 months for their nominal return counterparts). In total, bear markets lasted 123 months, or 19% of the time.
Table 4 describes the profile of the market recoveries. Returns ranged between 29% for the recovery following the mild 1970 bear market and 99% for the recovery following the deep 1973–74 bear market. The latter recovery lasted 74 months, or over six years. The most prolonged recovery came after the 2000–03 bear market, lasting 128 months or more than 10 years. As mentioned earlier, that bear market was a double-dip period where, after an incomplete recovery from 2003 to 2007, the market collapsed again in 2008–09.
Table 4 – Profile of Equity Market Recoveries Based on Real Returns
| Recovery Start Date | Recovery End Date | Recovery Duration(months) | Recovery Return |
| 1970-06-30 | 1971-04-30 | 10 | 29% |
| 1974-09-30 | 1980-11-30 | 74 | 99% |
| 1982-07-31 | 1984-12-31 | 29 | 57% |
| 1990-09-30 | 1993-07-31 | 34 | 42% |
| 2003-03-31 | 2013-11-30 | 128 | 87% |
| 2022-09-30 | 2024-03-31 | 18 | 31% |
| Average | 49 | 57% | |
| Sum | 293 | ||
| Percentage of Months | 44% |
Source: PWL Capital; Data source: DFA
Recoveries averaged 49 months, totalled 44% of the months from 1970 to 2024, and delivered an average return of 57%. Since bear markets lasted 19% of all months, investors spent 63% of the time (44% + 19%) either losing money or recovering their losses.
Table 5 describes expansion periods, when markets reached successive new all-time highs. These periods weren’t rare: they represent 37% of the months in our sample and produced an average real return of 79%. The expansion periods in the 1970s and early 1980s (periods of high inflation) were muted, with returns of only 0% to 17%. The expansion periods of the mid-1980s, the 1990s and the 2010s were much stronger, with returns exceeding 100%.
Table 5 – Profile of Market Expansion Phases Based on Real Returns
| Expansion Start Date | Expansion End Date | Expansion Duration(months) | Expansion Return |
| 1971-04-30 | 1973-01-31 | 21 | 17% |
| 1980-11-30 | 1980-11-30 | 0 | 0% |
| 1984-12-31 | 1987-08-31 | 32 | 119% |
| 1993-07-31 | 2000-08-31 | 85 | 154% |
| 2013-11-30 | 2021-12-31 | 97 | 103% |
| 2024-03-31 | 2024-12-31 | 9 | 13% |
| Average | 41 | 79% | |
| Sum | 244 | ||
| Percentage of Months | 37% |
Source: PWL Capital; Data source: DFA
Full cycles are illustrated in Table 6. Some cycles were extremely short: the 1970–72 cycle lasted only three years and returned 17%. Some cycles were extremely long. The longest cycle started at the 2000 market peak and ended at the beginning of the bear market of 2022, lasting more than 20 years (256 months). On average, a full cycle produced a real return of 80% and lasted 110 months, or over nine years.
Table 6 – Profile of Full Equity Market Cycles Based on Real Returns
| Cycle Start Date | Cycle End Date | Cycle Duration | Cycle Return |
| 1969-12-31 | 1973-01-31 | 37 | 17% |
| 1973-01-31 | 1980-11-30 | 94 | 3% |
| 1980-11-30 | 1987-08-31 | 81 | 122% |
| 1987-08-31 | 2000-08-31 | 156 | 156% |
| 2000-08-31 | 2021-12-31 | 256 | 103% |
| 2021-12-31 | 2024-12-31 | 36 | 16% |
| Average | 110 | 80% | |
| Sum | 660 | ||
| Percentage of Months | 100% |
Source: PWL Capital; Data source: DFA
The stock market is a money-multiplying machine for long-term holders of globally diversified equity portfolios. One dollar invested in equity on the last day of 1969 was worth over 16 dollars of real purchasing value at the end of 2024. Some people will scoff at the notion of staying invested for 55 years. But even over 10 years, investors sometimes doubled their purchasing power. Think about it. Investors did not work for that money. The market did the work. All investors had to do was defer consumption and accept that volatility is inevitable. But most difficult of all, the investors who benefited from this compounding of returns refrained from actively trading and let the market do its job. Trading interrupts the compounding of returns. Investment banks and trading platforms make money from your active trading, not you.
The 1970–2024 period mimics the length of an investor’s adult life. That period’s market behaviour is just one scenario from a million that could have occurred. The next 55 years will be different. Returns could be lower or higher in the future. Investors can maximize their chances of financial success by adjusting their saving and spending strategies over time. For retirees, this flexible strategy means spending more if the portfolio performs better than expected and less if it does worse. Investors in their accumulation phase may save less if the portfolio does better than expected and save more in the opposite case.
The performance of Canadian fixed income during the 1970–2024 period was exceptionally good. Because of the currently low bond yields, investors should not expect this type of performance to repeat. Meanwhile, stock returns were roughly average, so the period reviewed provides a reasonable guide for expectations about the future. Thus, bonds will likely underperform stocks by a wider margin than during the 1970–2024 period. Investors who seriously want to accumulate wealth need a substantial equity allocation.
The most striking finding of this paper is not that a dollar invested for 55 years turned into 16 inflation-adjusted dollars. It is that such wealth creation occurred despite two decades with zero or negative returns. Long droughts can unexpectedly follow a period of high returns. The reverse is also true. Successful investors tolerate long periods of minimal or even negative returns. These periods are the entry price to join the club of successful long-term investors.
That being said, return compounding is an exponential function. Those who start saving and investing early and persevere with their diversified portfolio strategy will benefit the most.
[1] Source: PWL Capital; Data sources: Dimson, Marsh and Staunton, DFA