
The trade war between the US and the rest of the world has propelled market volatility. The danger for investors is to shift into a narrow perspective dictated by the fear of losing money. This post reviews the various phases that equity investors have faced over the last 55 years. While holding stocks during bear markets is bitter medicine, it is essential for compounding wealth.
The goal of long‑term investing is to leverage the effects of return compounding to accumulate wealth. This is not a smooth process, even with a broadly diversified portfolio. Learning about market declines, recoveries, and expansions prepares investors to navigate periods of elevated uncertainty. Understanding market cycles may help them to devise a rigorous investment plan and stick with it. Investors need to be strategic in building wealth, avoid being distracted by market volatility, and capitalize on the benefits of compounding.
This article looks at the period from 1970 to 2024 with the goal of shedding light on the following questions:
For this article, we examined equity market cycles from the perspective of a Canadian investor holding a globally diversified portfolio from 1970 to 2024.
We constructed a 100% bond portfolio, a 100% equity portfolio, and three portfolios simulating different mixes of stocks and bonds: 40/60, 60/40, and 80/20.
Returns were computed in Canadian dollars. Portfolios were rebalanced monthly.
The equity portfolio mimicked the market exposure of the Vanguard Global Equity ETF (VEQT), with 30% allocated to a Canadian equity market‑cap‑weighted index and 70% to a global ex‑Canada equity index. Foreign withholding taxes and a 0.24% expense ratio were factored in to simulate an actual investor experience.
The bond portfolio held the total Canadian bond market index minus 0.24% for fees. Where data on the total Canadian bond market were unavailable, we used a portfolio of a similar duration with 50% Canadian treasury bills and 50% Canadian long‑term bonds.
We measured market cycles using total monthly return data, which includes dividend and interest payments. Using monthly total returns instead of daily prices or intra‑day prices erases some historical bear markets. For example, the 2020 bear market began in February and bottomed out in mid‑March, followed by a significant rally late in that month. Thus, the monthly data do not show a bear market in 2020. Similarly, the monthly total return data includes dividends, which offset part of the 2022 market decline, so it does not appear as a bear market in our data. Our goal is not to meticulously document all historical bear markets, but rather to provide insight into market cycles.
With market cycles comes the notion that building wealth through equity investments is not a linear experience: there are advances and setbacks. Stockholders are compensated primarily to endure these setbacks, or bear markets. The cycle goes as follows:
It’s easy to discuss market cycles, but make no mistake: turning points can only be identified in hindsight. Figure 1 illustrates the market cycle phases with the performance of $100 invested in the global equity market portfolio during the 1970s.
Figure 1 – The Equity Market Cycle
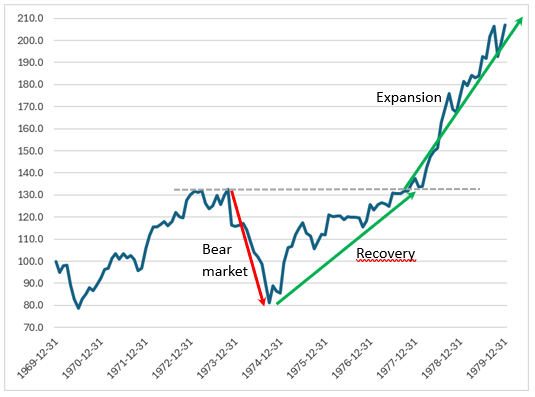
Source: PWL Capital; Data Source: DFA
Table 1 presents the annualized returns, volatilities, and compound values of a one‑dollar investment over 55 years for various portfolios. As expected, returns, volatilities, and compound values increase with equity weights. The modest return difference of less than 2% between fixed income and global equity is explained by the excellent performance of Canadian bonds during the period, as well as the high proportion of corporate and provincial bonds in the index. At the end of 2024, a dollar continuously invested in fixed income from January 1970 to December 2024 was worth $48, compared to $130 for global equity. A 60/40 portfolio produced twice the amount of dollars as an all‑fixed‑income portfolio.
Table 1 – Nominal Return and Volatility of Portfolios, 1970–2024
| Portfolio | Annualized Return | Volatility | Final Value of $1 invested in January 1970 |
| Fixed Income | 7.32% | 5.74% | $48.65 |
| 40EQ60FI | 8.30% | 6.87% | $80.46 |
| 60EQ40FI | 8.69% | 8.59% | $98.06 |
| 80EQ20FI | 9.01% | 10.65% | $115.21 |
| Global Equity | 9.26% | 12.89% | $130.44 |
Source: PWL Capital; Data Source: DFA
On average, global equity returned 0.80% per month. Global stocks produced positive returns in 64% of the months. The best month was January 1975 with a 15.9% return, and the worst was, not surprisingly, October 1987 with a return of ‑18.4%.
Turning our attention to the equity portfolio, Table 2 shows that there were seven bear markets during the period, or an average of 1.3 per decade.
Table 2 – Profile of Equity Portfolio Bear Markets, 1970–2024
| Contraction Start Date | Contraction End Date | Contraction Duration (months) | Contraction Return |
| 1969-12-31 | 1970-06-30 | 6 | -21% |
| 1973-10-31 | 1974-09-30 | 11 | -39% |
| 1980-11-30 | 1982-07-31 | 20 | -22% |
| 1987-08-31 | 1987-11-30 | 3 | -22% |
| 1989-12-31 | 1990-09-30 | 9 | -23% |
| 2000-08-31 | 2003-03-31 | 31 | -43% |
| 2007-05-31 | 2009-02-28 | 21 | -42% |
| Average | 14 | -30% | |
| Sum | 101 | ||
| Percentage of Months | 15% | ||
Source: PWL Capital; Data Source: DFA
On average, bear markets lasted 14 months, with the longest lasting 2.5 years and the shortest lasting 3 months. Bear markets also varied widely in severity, with some barely exceeding a 20% decline, while others involved drops of more than 40%. On average, bear markets returned -30%. Overall, the global equity portfolio was in a bear market 15% of the time, or 8.5 out of the 55 years reviewed here.
Table 3 provides details of the recoveries since 1970. They lasted an average of 28 months—twice the average duration of the bear phase of the market cycle. They required a 49% average gain before completely offsetting their corresponding bear markets. In total, recoveries lasted 194 months, the equivalent of 16 years of our 55‑year history, or 29% of the time.
Overall, 44% of the months in our sample (15% + 29%) were either bear markets or recoveries from bear markets. Markets are generally positive most of the time, but a significant portion of these positive returns serve to offset past losses.
Table 3 – Profile of Equity Portfolio Recovery, 1970–2024
| Recovery Start Date | Recovery End Date | Recovery Duration (months) | Recovery Return |
| 1970-06-30 | 1971-03-31 | 9 | 28% |
| 1974-09-30 | 1977-11-30 | 38 | 66% |
| 1982-07-31 | 1982-12-31 | 5 | 29% |
| 1987-11-30 | 1989-07-31 | 20 | 33% |
| 1990-09-30 | 1993-02-28 | 29 | 31% |
| 2003-03-31 | 2006-11-30 | 44 | 81% |
| 2009-02-28 | 2013-03-31 | 49 | 73% |
| Average | 28 | 49% | |
| Sum | 194 | ||
| Percentage of Months | 29% |
Source: PWL Capital; Data Source: DFA
Expansions are uneven. As outlined in Table 4, they can last anywhere from over 10 years to just a handful of months. On three occasions, they returned more than 200%, but on two others, they produced minimal returns. From 1970 to 2024, the stock market was in expansion 55% of the time, or 365 out of 660 months. On average, expansion periods lasted 52 months and produced a 124% return.
Table 4 – Profile of Equity Portfolio Expansions, 1970–2024
| Expansion Start Date | Expansion End Date | Expansion Duration (months) | Expansion Return |
| 1971-03-31 | 1973-10-31 | 31 | 31% |
| 1977-11-30 | 1980-11-30 | 36 | 104% |
| 1982-12-31 | 1987-08-31 | 56 | 233% |
| 1989-07-31 | 1989-12-31 | 5 | 2% |
| 1993-02-28 | 2000-08-31 | 90 | 235% |
| 2006-11-30 | 2007-05-31 | 6 | 7% |
| 2013-03-31 | 2024-12-31 | 141 | 255% |
| Average | 52 | 124% | |
| Sum | 365 | ||
| Percentage of Months | 55% |
Source: PWL Capital; Data Source: DFA
Overall, equity market cycles during the period from 1970 to 2024 were very diverse. The shortest cycle, which began in 1987, lasted only 28 months and yielded very little return before reverting to another bear market. At the end of 2024, we were in the longest market cycle since 1970, spanning 211 months or 17.5 years. This cycle has also been the most lucrative, with a 256% return on investment.
Table 5 – Profile of Equity Cycles, 1970–2024
| Cycle Start Date | Cycle End Date | Cycle Duration (months) | Full Cycle Return |
| 1969-12-31 | 1973-10-31 | 46 | 33% |
| 1973-10-31 | 1980-11-30 | 85 | 107% |
| 1980-11-30 | 1987-08-31 | 81 | 236% |
| 1987-08-31 | 1989-12-31 | 28 | 5% |
| 1989-12-31 | 2000-08-31 | 128 | 238% |
| 2000-08-31 | 2007-05-31 | 81 | 12% |
| 2007-05-31 | 2024-12-31 | 211 | 256% |
| Average | 94 | 127% | |
| Sum | 660 | ||
| Percentage of Months | 100% |
Source: PWL Capital; Data Source: DFA
Equity market returns were positive for 64% of the months between 1970 and 2024. However, the market was down in 36% of the months, including 15% in full bear markets.
Bear markets can be extreme and require considerable time to recover from. On average, recoveries lasted twice as long as bear markets.
The average equity cycle lasted almost eight years. Some of these cycles were highly lucrative, while others were less so. Investors can only know what type of cycle they’re in after the fact.
The stock market is a money‑multiplying machine. Because the turning points between market cycle phases are largely unpredictable, the only reliable way to invest profitably is to stay invested over decades, ignore distractions from media news, and let returns compound.
Nominal returns tell only part of the story of how markets create value. In my next post, I will review investment cycles through the lens of real (inflation-adjusted) returns.